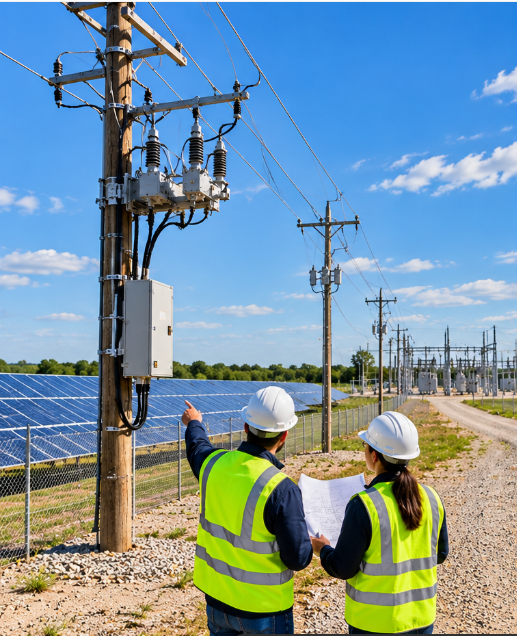
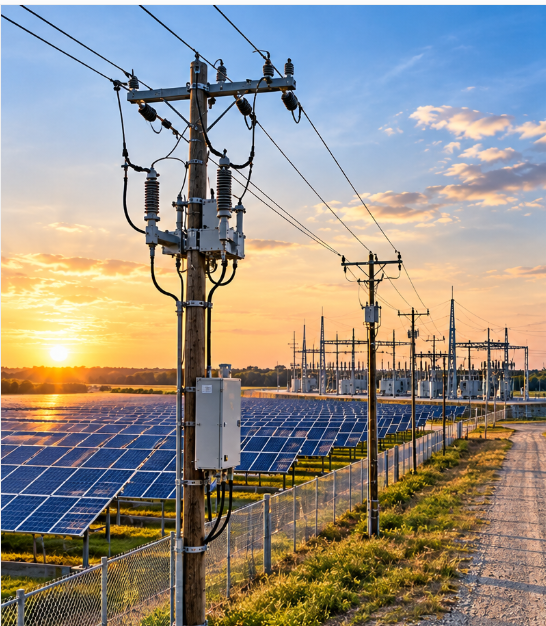
RWE required clear and functional interconnection diagrams for 30 sites across Delaware, Maryland, and Virginia to ensure seamless integration with the utility grid.
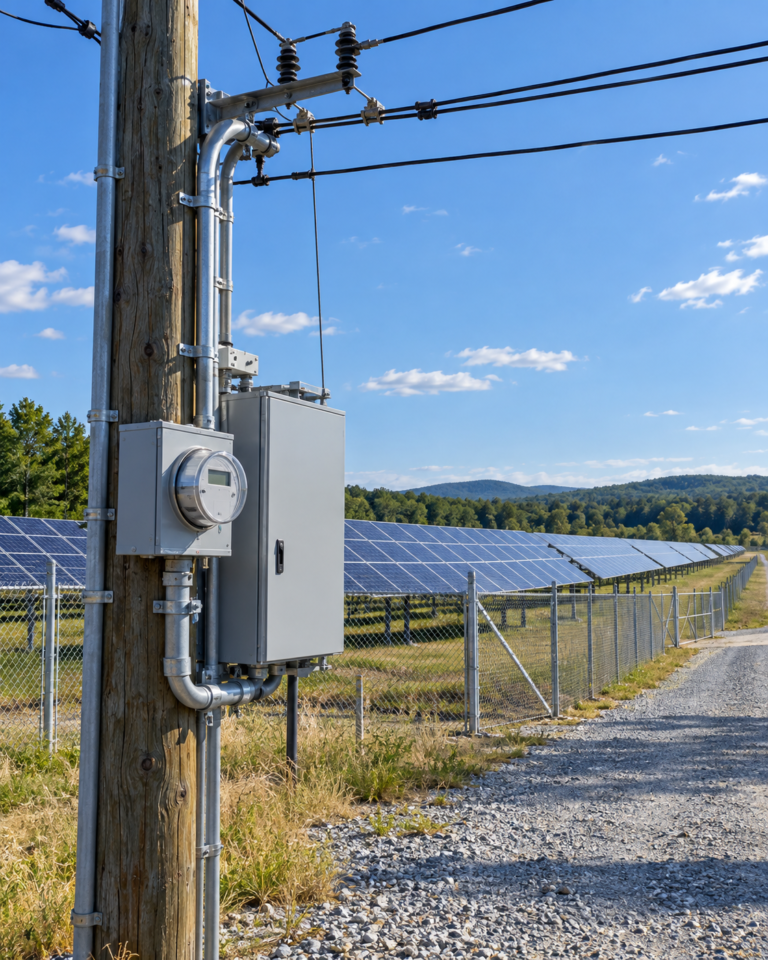
These diagrams needed to depict interconnection points, utility meters, recloser poles, and the flow of electricity from the solar sites to the substation.
For a separate set of five solar PV projects (Delmarva Felton B, Frankford B, Laurel E, Harbeson A, Lewes A), RWE received interconnection cost estimates from the utility that seemed potentially inflated.
This raised concerns about project economics and required a thorough cost analysis.
Action
Our team designed detailed Single Line Diagrams (SLDs) for each of the five initial solar sites (Delmar B, Delmar C, Delmar D, Felton B, Lewes A).
These SLDs mapped all key interconnection components, ensuring clarity and functionality.
For the second set of projects (Delmarva Felton B, Frankford B, Laurel E, Harbeson A, Lewes A), DST Engineers leveraged our expertise in utility processes to conduct a high-level cost review.
We compared the utility’s estimates with industry standards and the client’s budget, identifying areas for potential cost savings and clarification.
DST Value Addition
The clear and functional interconnection diagrams facilitated a smooth implementation process for all five initial solar projects.
Our cost analysis on the second set of projects identified opportunities for a 35% reduction in overall interconnection costs.
This significant cost optimization improved project economics and empowered RWE with detailed insights for effective negotiation with the utility.